Investigation · MAID · federal recordActive investigationPrimary sources
State-administered death.
Health Canada’s annual reports document the volume, growth, and Track 2 share of
medical assistance in dying. This file is the accountability shelf for those numbers —
and the door into the five-act argument under Rome Statute Article 6. Confirmed figures
below cite Health Canada; estimates beyond the last published report are labeled as estimates.
16,499Provisions in 2024Health Canada annual report
5.1%Of all deaths, 2024One in twenty Canadian deaths
76,475Cumulative (corrected)Through Dec 2024 · federal series
4.7%Track 2 share, 2024Death not reasonably foreseeable
Some secondary summaries cite a higher running estimate after Dec 2024 by extrapolating
daily rate. This page treats Health Canada’s published annual and cumulative tables
as ground truth; open the report to verify.
Code chart · federal annual series
Provisions by year.
Live SVG from the published Health Canada annual counts (oldest → newest).
Same glass chrome as the homepage chart shelf — open the report to verify each point.
This composite lives on the demographic board (MAID + opioids + intake + continuity). Open that page for labeled charts — not a substitute for Health Canada volume above.
atmospheric loops and stills set memorial tone so the numbers hold attention.
Accountability claims route to Health Canada annual MAID reports,
Hansard, Ontario MDRC, and the five-act stages — not to the film layer.
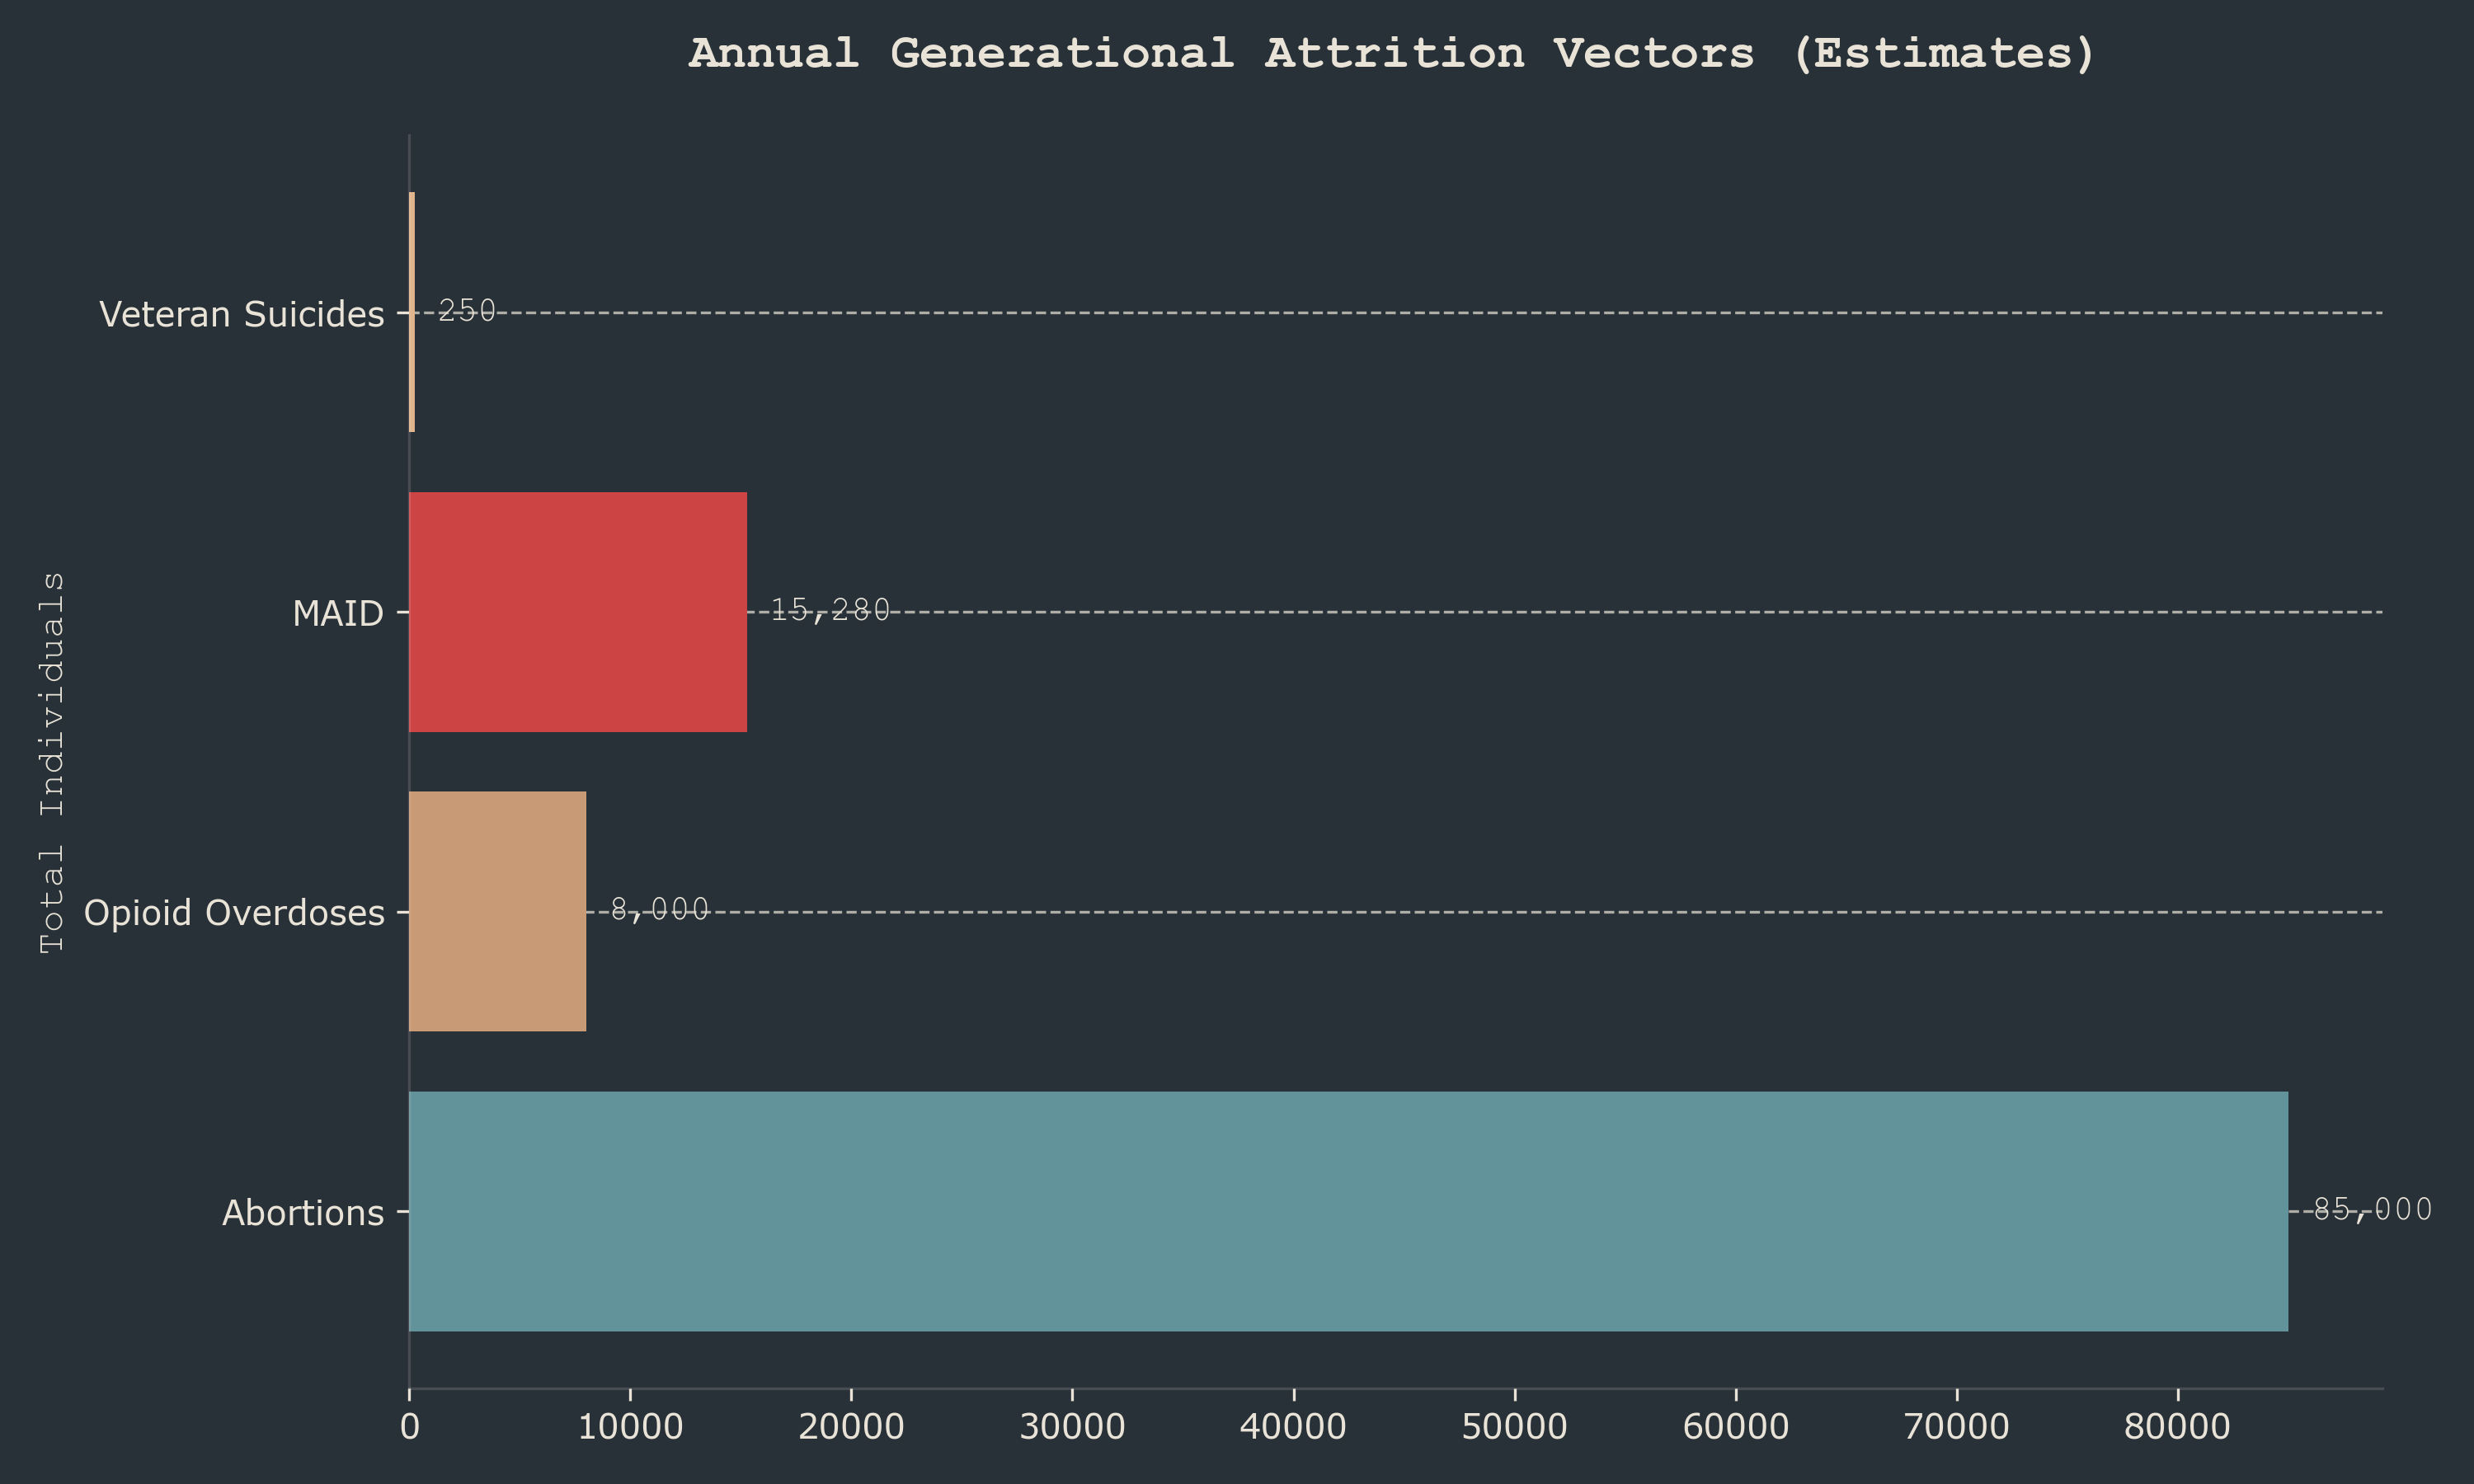
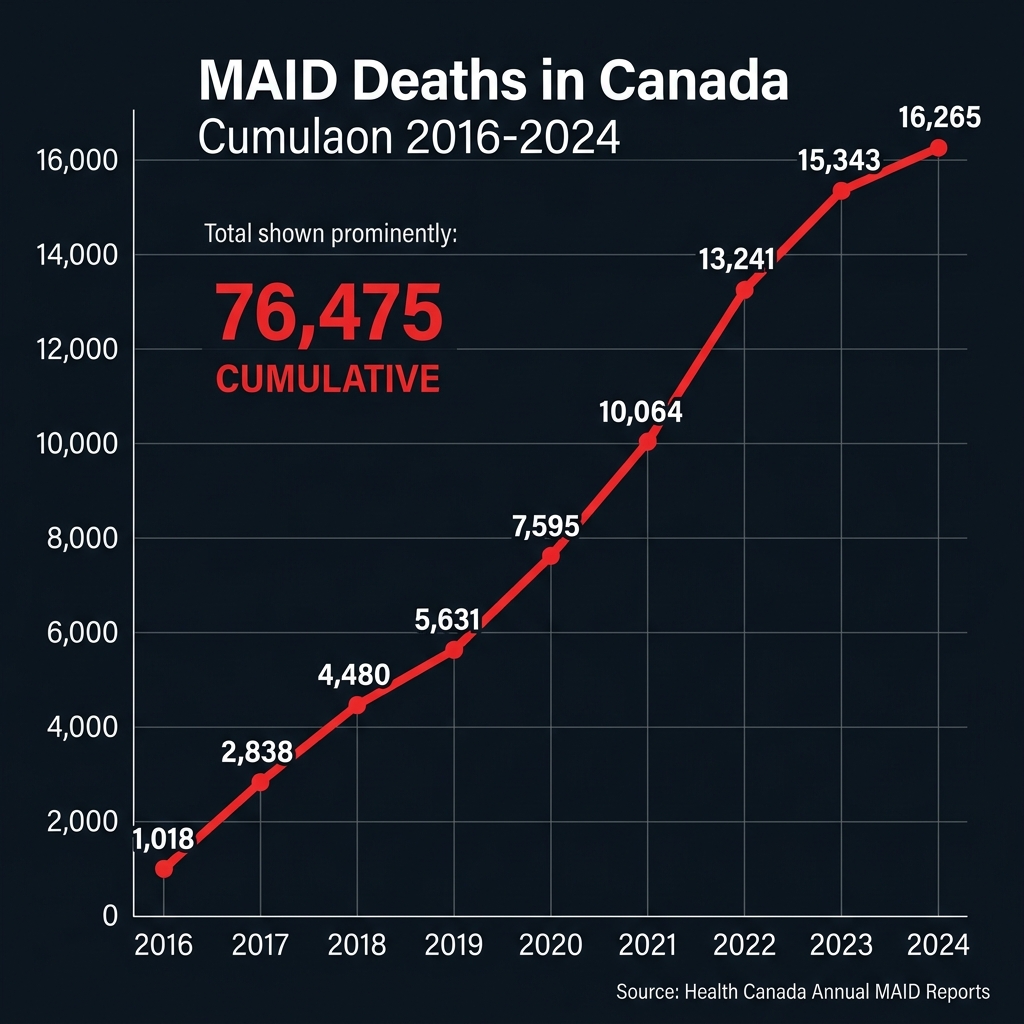

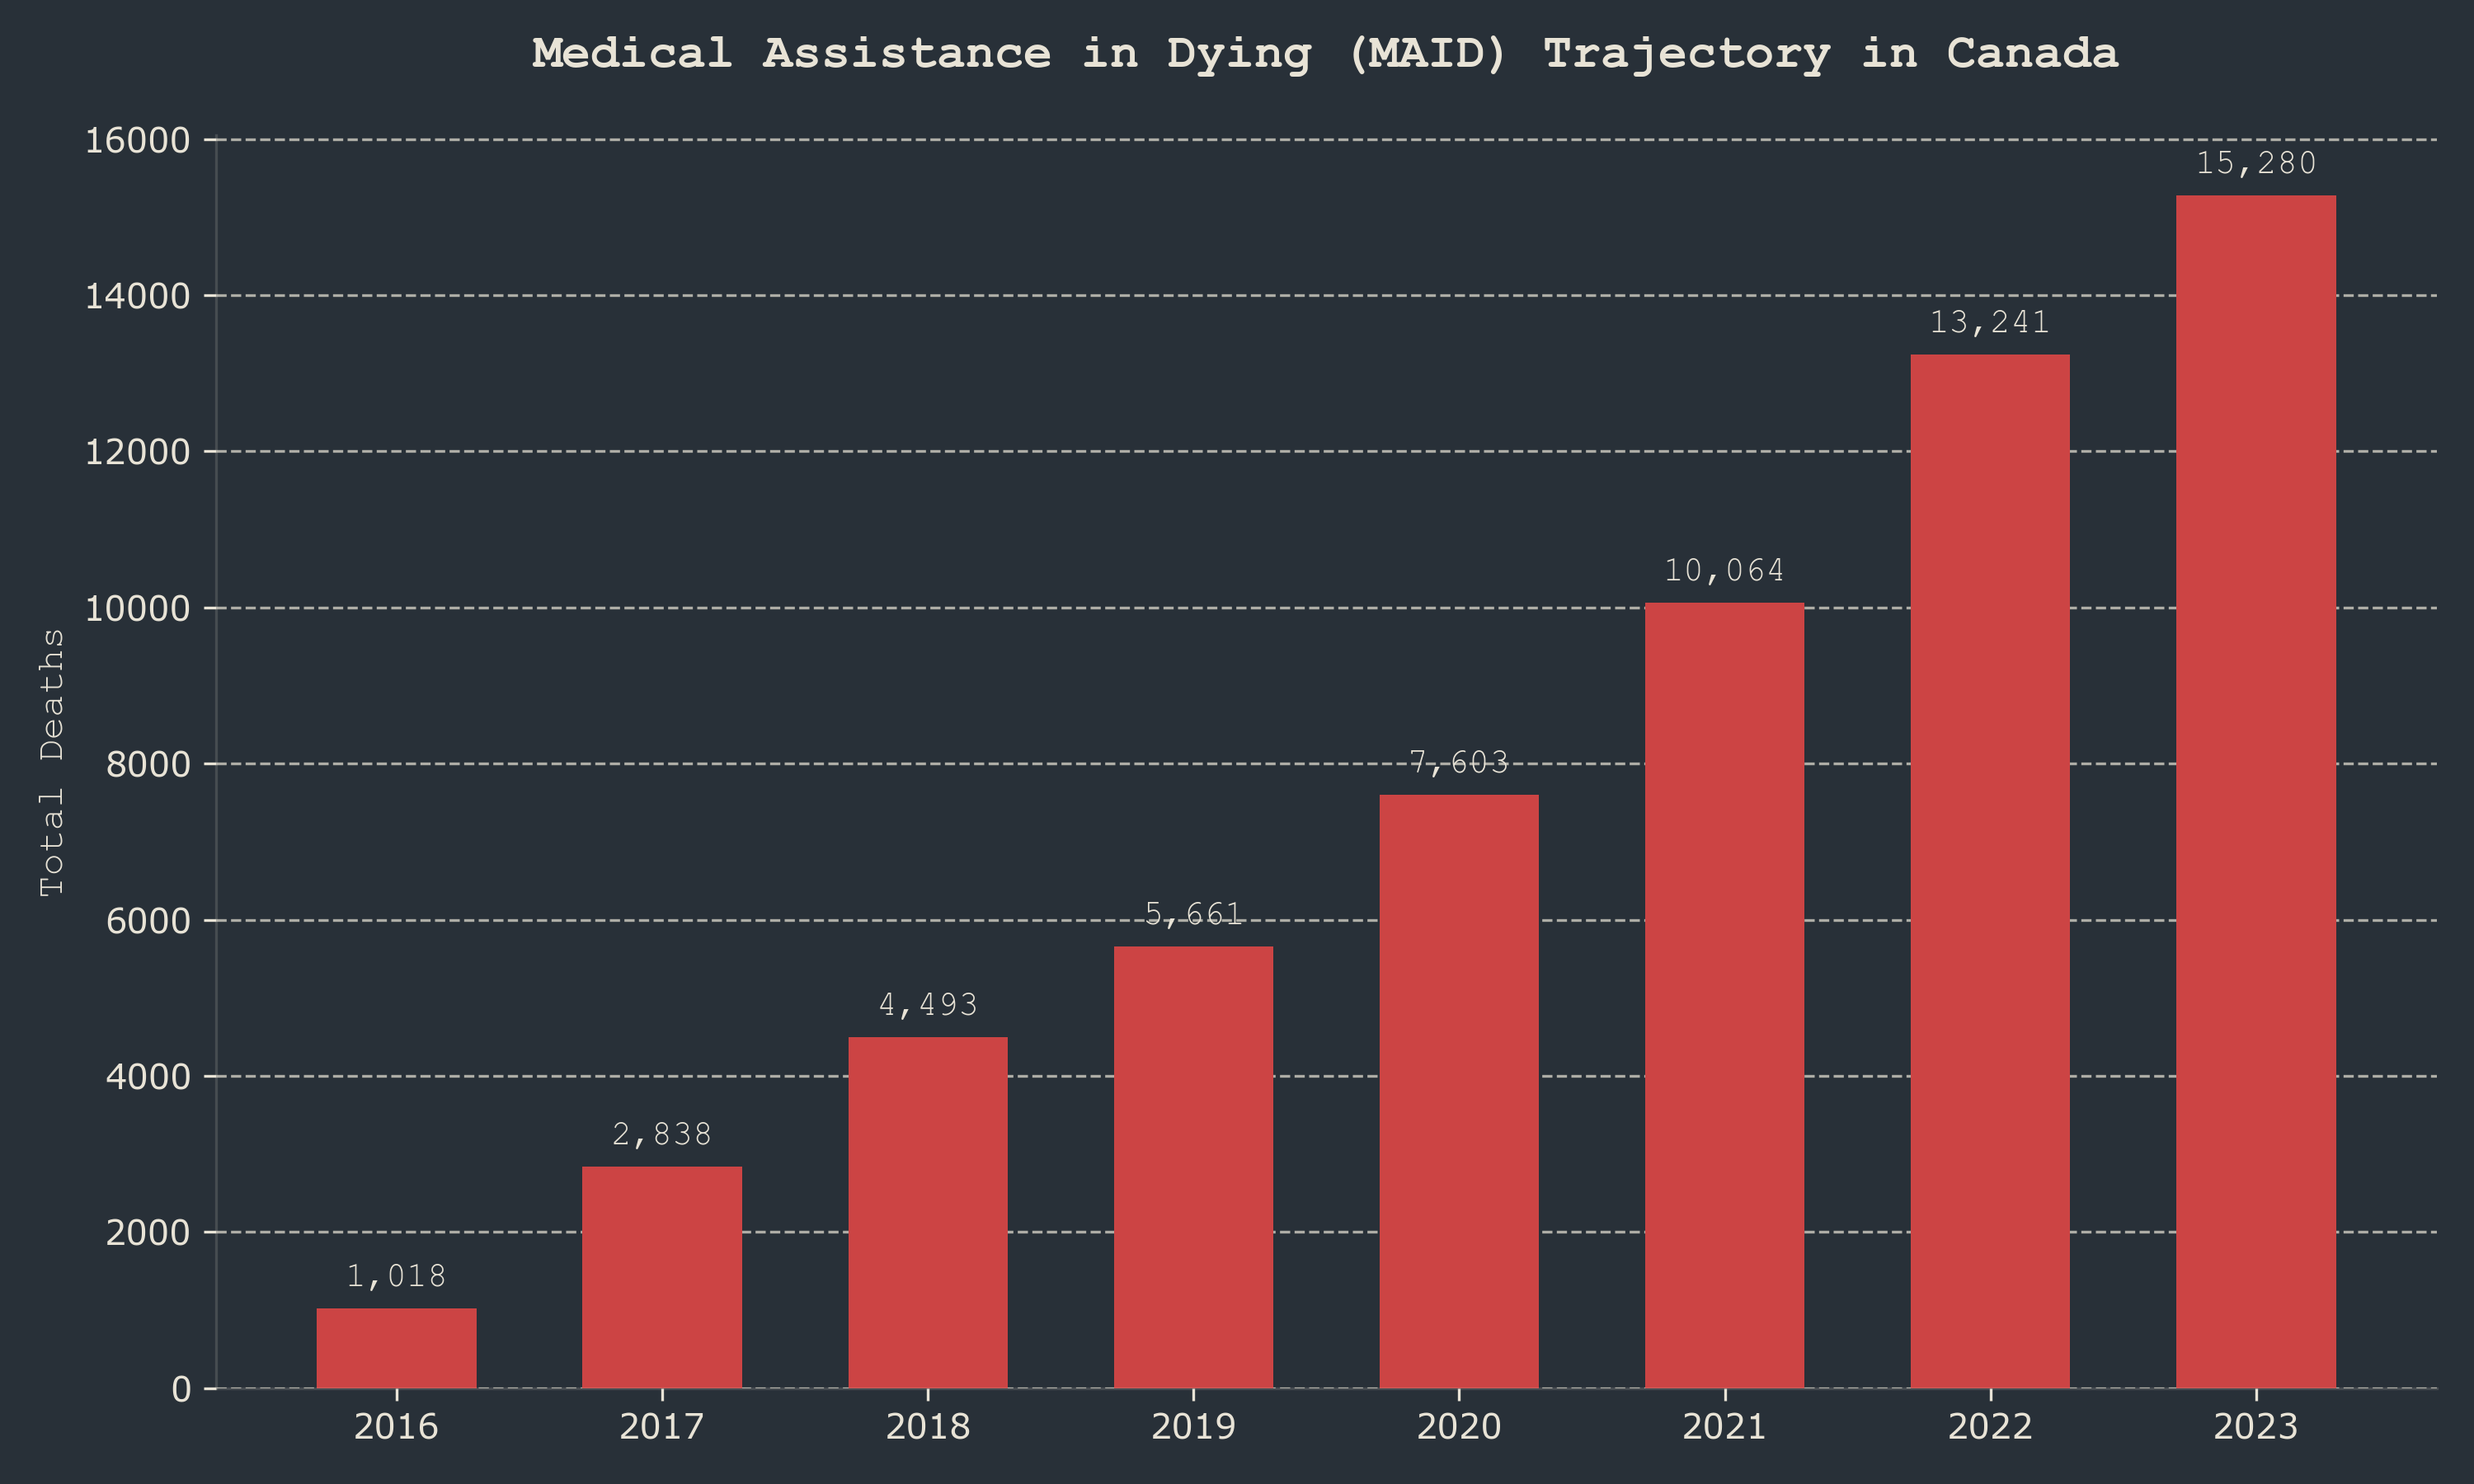 Chart · volume